

The 120 Week Wall: Why Transformers (Not GPUs) are the Real AI Bottleneck?
How 200-ton blocks of steel are quietly liquidating the AI CapEx boom.

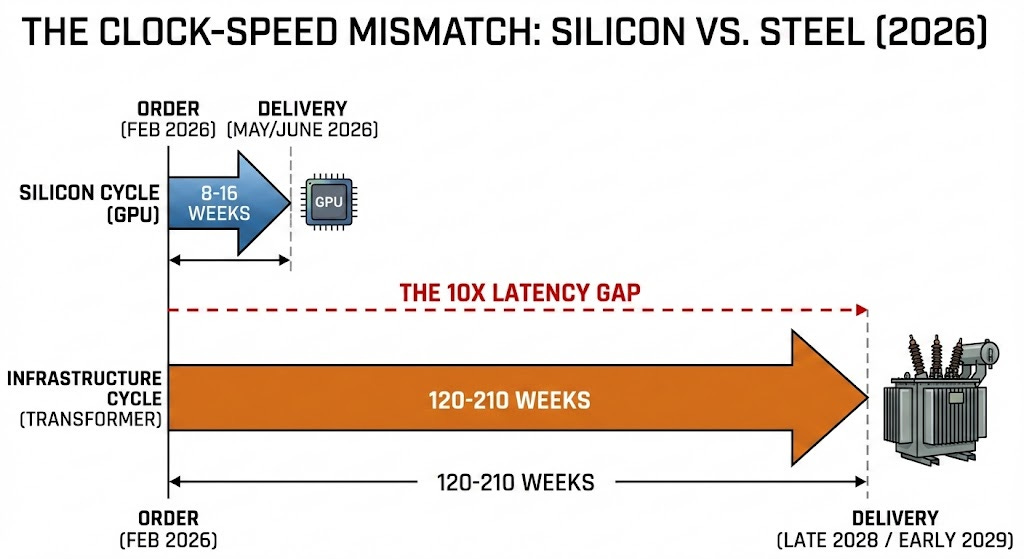
Executive Summary: The Clock-Speed Mismatch In the digital realm, we measure progress in 24-month Moore’s Law cycles. But the physical grid—the motherboard of the AI revolution—operates on a mid-20th-century industrial clock. You can “Agile” your way through a software bug, but you cannot “Agile” your way through the 120-week curing time of high-voltage transformer oil. While the market celebrates the normalization of GPU supply, it is turning a blind eye to a massive Hardware Latency Gap that is turning billions in “Silicon” into Stranded Assets.
The Diagnostic:
The Latency Delta: As of February 2026, flagship AI GPU lead times (NVIDIA H200/B200) have stabilized at 8–20 weeks. Conversely, Large Power Transformers (LPT) are quoting 80 to 210 weeks. We are attempting to plug a 16-week “Brain” into a 144-week “Heart” [1, 2].
The Steel Choke Point: The U.S. remains critically dependent on a single domestic point of failure for Grain-Oriented Electrical Steel (GOES): Cleveland-Cliffs Butler Works. Despite a $195M expansion, new capacity won’t be operational until July 2028, leaving AI expansion capped by a shortage of specialized atoms [3].
The Demand Shock: U.S. data center power demand is pivoting from 30 GW toward a projected 90 GW to 120 GW load by 2030. This “Always-On” demand is hitting a grid where 70% of infrastructure is over 25 years old. We are redlining a legacy machine [4, 5].
Layer 1: Inventory & Steel (The Two-Front War) To understand why AI projects are stalled, you must look past the chip and into the transformer core. The crisis is a raw material bottleneck (GOES) collided with an exponential Demand Surge.
The Domestic Bottleneck: The U.S. AI “Physical Stack” relies on one facility: Cleveland-Cliffs’ Butler Works. As of February 2026, their $195M expansion is still awaiting final approvals, with an operational target of July 2028. This creates a two-year “Dead Zone” in domestic supply [3].
The APAC Dependency: Because domestic supply is capped, the U.S. is 85% dependent on foreign GOES mills. If you are building today, you aren’t waiting on a factory; you are waiting on a cargo ship to navigate a fragile global logistics geometry.
Layer 2: Throughput (The Transmission Latency) Even with hardware in hand, the “Path to Power” is blocked by physical and regulatory friction.
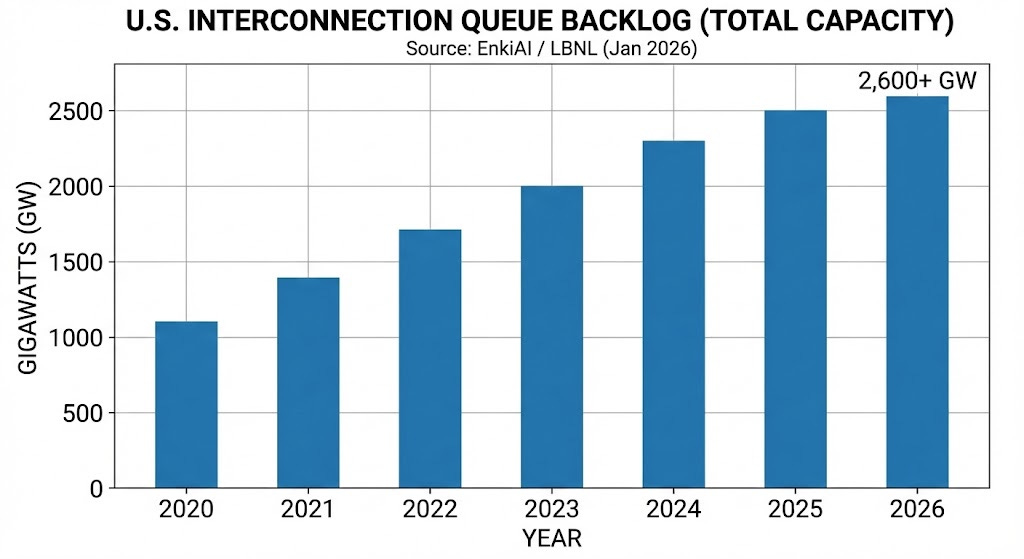
The Interconnection Queue: Total capacity sitting in U.S. queues has swelled to 2,600 GW—nearly double the entire installed generation capacity of the country. The median wait to be “Energized” is now 53 months [6, 7].
The “Thermal Sag” Limit: High-voltage lines in “Data Center Alley” (Virginia) are approaching their thermal limits. When you push 24/7 AI-level current, they heat up and physically sag, risking catastrophic arcing. You cannot “patch” a sagging line; you have to spend 7–10 years building new towers [8].

Tracking the physical constraints of the AI era requires more than just silicon news. Join the first wave of systems polymaths receiving this diagnostic every Monday
Layer 3: Thermodynamics (The Hydraulic Constraint) Computation is physically the process of converting electricity into heat. In 2026, we are hitting a “Thermal Wall.”
The Density Shift: AI racks have jumped from 15 kW to 120 kW+. Air cooling is physically incapable of dissipating this heat flux, forcing a shift to liquid cooling in 76% of new builds [9, 10].
The “Thirst” of AI: A large hyperscale facility can consume 5 million gallons of water per day. This demand is colliding with local geography, leading to “Water Moratoriums” in the Southwest U.S. that mirror the grid’s power bans [11, 12].
Layer 4: System Load (The Geographic Risk) System Load is a physical pressure. The concentration of compute in “hotspots” is triggering a localized collapse of grid availability.
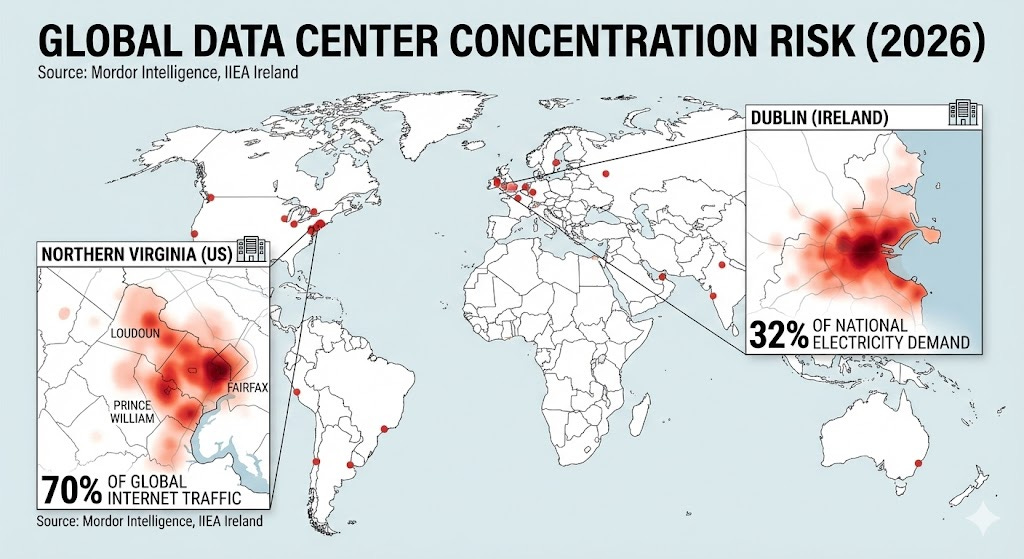
Northern Virginia: Roughly 70% of global internet traffic flows through three counties here. Data centers are projected to consume 46% of Virginia’s electricity by 2030, turning the region into a massive single point of failure [13].
Dublin, Ireland: Data centers are projected to hit 32% of total national electricity demand by late 2026. This has forced a Hard Stop, with a moratorium on new builds until 2028 to prevent domestic blackouts [14].

Layer 5: Redundancy (The Single Point of Failure) The “Physical Stack” of AI is remarkably fragile. If a single facility (Butler Works) goes offline, the U.S. transformer production line stops instantly. In a 2026 geopolitical climate, “Electrical Steel” is as much a strategic weapon as “Advanced Silicon.”
Audit Conclusion: The Hardware Latency Mismatch
The “AI Boom” is currently decoupled from the physical map. The 10x delta in lead times suggests the “Critical Path” for expansion has shifted from silicon to steel. In the 2026 AI race, the winner isn’t the one with the best model; it’s the one who secured their substation hardware in 2023.
Next week, we move from the grid to the border. The '120-Week Wall' isn't just a physics problem; it's becoming a national security one. We’ll be auditing the 'Sovereign AI' residency requirements hitting Canada this month and what it means for the future of the borderless cloud.
The Geo Constraints Manifesto I started this publication because the gap between what we ship in code and what the grid can physically handle has become too large to ignore. You are reading the first issue of Geo Constraints.
As a Founding Reader, you’ll help shape this diagnostic from the ground up. Next Monday, we pivot from the grid to the border: “Sovereign AI: The end of the borderless cloud.” We’ll be auditing the new 100MW residency requirements hitting Canada this month and what it means for the future of jurisdictional compute.
Don’t miss the diagnostic.
Technical Appendix: The 2026 Audit Trail
[1] Silicon Latency Normalization: FinancialContent (Feb 5, 2026). TSMC Arizona Achieves Volume Parity; GPU Lead Times Stabilize.
[2] Transformer Lead-Time Crisis: ELSCO Transformers (Jan 13, 2026). Average Lead Times of Dry Type Transformers in 2026.
[3] The Domestic Steel Choke Point: Cleveland-Cliffs Inc. (Jan 14, 2026). Congressional Steel Caucus Testimony: Chairman Lourenco Goncalves.
[4] Butler Works Operational Target: Butler Eagle (Feb 3, 2026). Cleveland-Cliffs Butler Works Expansion to see Vote in March.
[5] Strategic Trade Alliances: Cleveland-Cliffs (Sept 17, 2025/Jan 2026). Announcement of POSCO Strategic Partnership.
[6] US Interconnection Backlog: Lawrence Berkeley National Laboratory (Jan 2026). Queued Up: Characteristics of Power Plants Seeking Interconnection.
[7] US Grid Infrastructure Integrity: ASCE 2025 Report Card / Utility Dive. US Energy Infrastructure Gets a D+ from American Society of Civil Engineers.
[8] Global Electricity Load Forecast: International Atomic Energy Agency (Jan 2026). Data Centres and AI Eye Advanced Nuclear to Meet Power Needs.
[9] Rack Density Evolution: Arctiq (Jan 8, 2026). The 8 Data Center Trends That Will Define 2026.
[10] Liquid Cooling Adoption Metrics: AIRSYS North America (Jan 5, 2026). Data Center Trends & Cooling Strategies to Watch in 2026.
[11] Data Center Water Vulnerability: GOV.UK / Net Zero Insights (Aug 2025/Feb 2026). Report: Water Use in AI and Data Centres.
[12] Northern Virginia Grid Pressure: Morgan Lewis (Dec 5, 2025). Data Center 2026 Outlook: Energy and Infrastructure.
[13] Regional Capacity Moratoriums: Data Centre News UK (Jan 31, 2026). Ireland Unveils Strict New Rules for Data Centre Power Use.
[14] Ireland Grid Saturation: International Energy Agency (Dec 18, 2025). IEA Report: Powering Ireland’s Energy Future.
Know a Systems Polymath or Infra Analyst who is mispricing the 120-week wall? Share this audit with them.